Process
- The process: Urbanism projects are often filled with complexity or ‘fuzzy’ targets – a clear process is needed that allows for flexibility without loosing focus.
- Accessing knowledge: Knowledge related to sustainability is vast and diverse but is necessary to support decision making – including how to access knowledge and how to link topics.
- Diagnosis and evaluation: In order to assess the condition a diagnostic system is needed. This helps to guide the analysis process, identify priorities and evaluate progress.
- Synthesis: Finally, once a project has been diagnosed, it is necessary to synthesise information into a format that can be easily communicated without wading into unnecessary detail.
1. What is the process?
It is easier to chart a course before leaving port, but once at sea the ship must handle the storm without losing site of its destination.
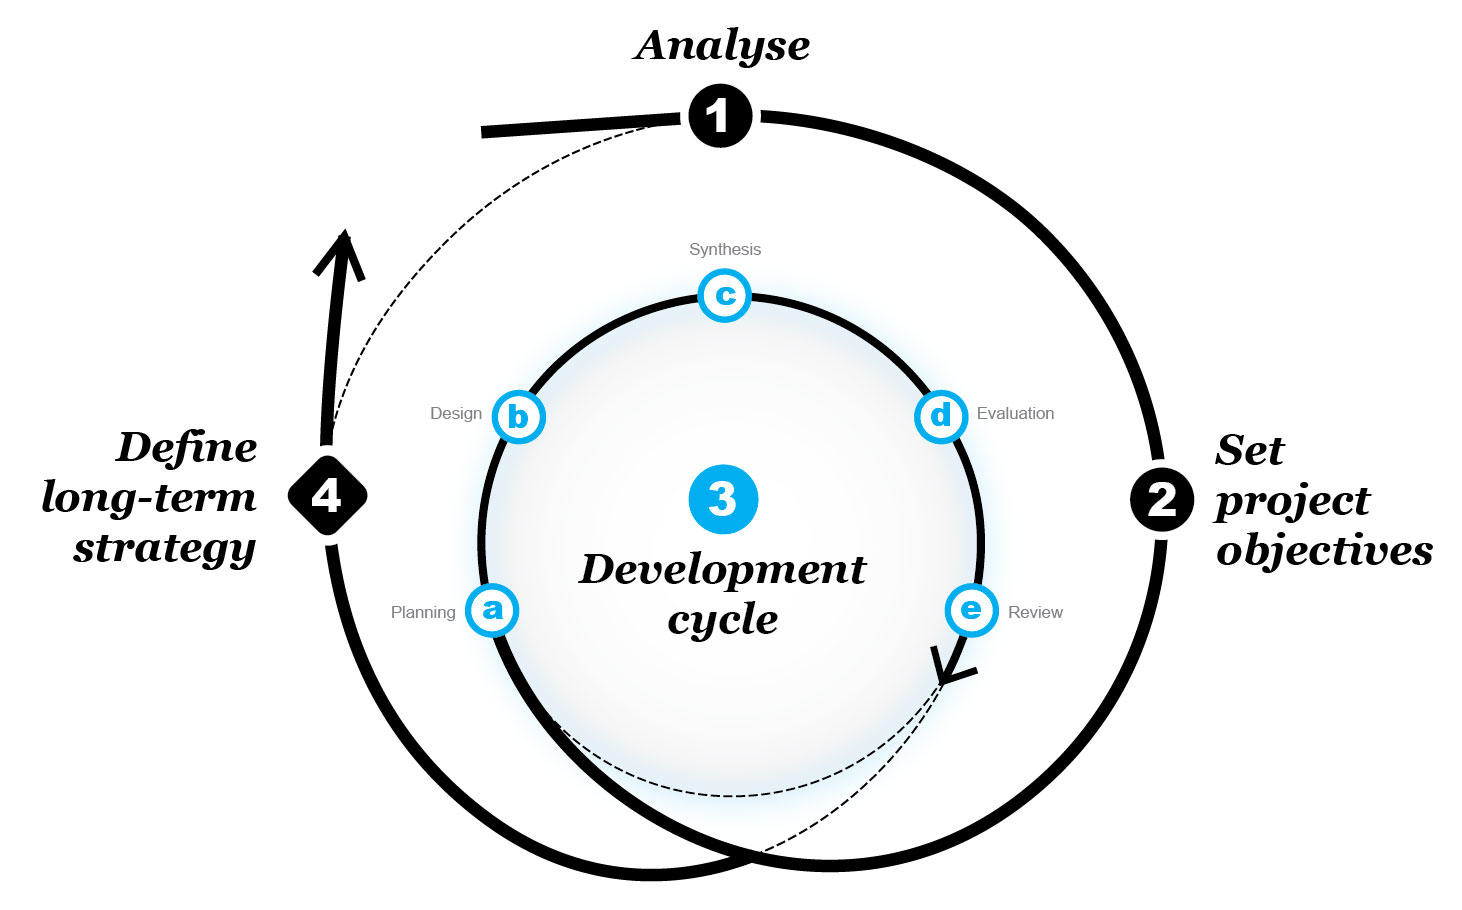
The compass methodology (see above) is used to manage complex projects. It is intended to be agile and flexible however provide a clear process so the team and stakeholders are aware when there are moments when to act. This iterative process is far more compelling than the typical ‘waterfall’ approach used when outcomes are fairly predictable*. This approach introduces four key moments:
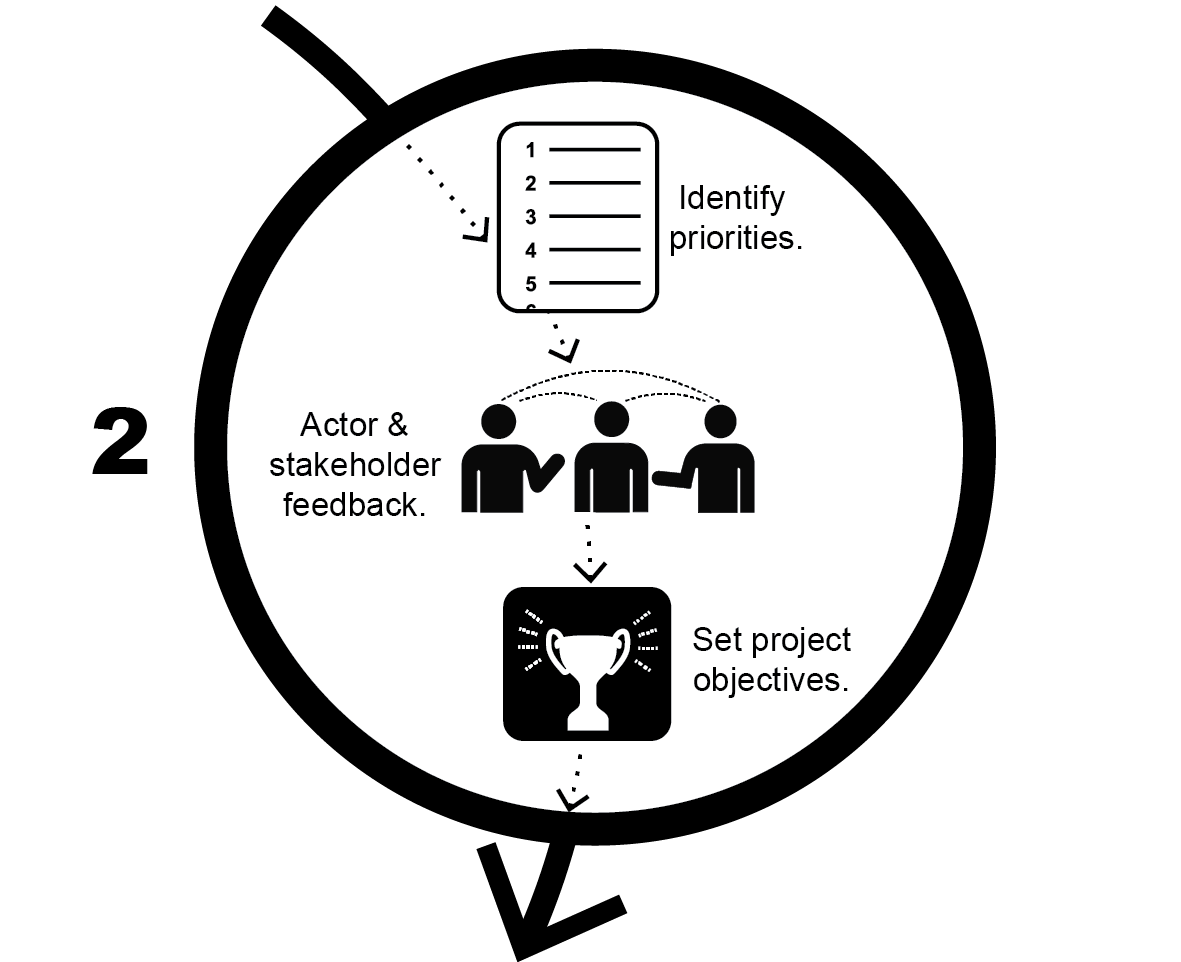
- The analysis helps find priorities and set objectives. This period involves simply diagnosing problems by prioritising those that are in the most critical and most relevant to the site. We explain the diagnosis process later.
- The objectives are set at the very beginning before the formal design is developed. This stage can involve workshopping ideas and ’research by design’ to further refine the objectives. Regardless, the objectives remain relatively flexible and are agreed on by the project team, client or stakeholders to ensure there are common priorities.
- The objectives are then developed and tested through an iterative development cycle. The aim is to develop the project in short cycles and compare progress against the objectives set in step 2. Each cycle involves a ‘Minimum Viable Product’, that is a kind of prototype that can be ‘tested’. The team decides what aspects require most attention. As the outcomes are unclear from the beginning, this means that there is no set template or guideline for reaching the objectives and this needs to be re-discussed at the end of each cycle.
- Finally, the completion of a project does not mean that a problem is resolved and may require ongoing research or development. Many urbanism projects require greater level of detail so appropriate architects, engineers, social planners and so on should be involved. Therefore it is important that a longer term strategy is taken, even if the development team is not directly involved.
See also the Tram Track Tracer case study, a complex mobility project were design decisions could be regularly tested and refined.
Why NOT use the waterfall method
Projects typically fall into two categories.
In the first category, there are projects that are fairly easy to plan and where there is a relatively clear course of events. This may involve, for example, designing a house or a school or the construction of a road. The waterfall method, directly above, is a typical project management approach. It is simple and logical however does not offer flexibility.
Urban planning is quite particular in the sense that knowledge is often gained heuristically – as the project is being developed. The second category belongs to complex projects where outcomes are very unclear. This means that we cannot expect what will emerge over time and we cannot define clear outcomes. However we can set project objectives which can be refined as the project is being developed. Analysis, development and testing must occur regularly to learn and adapt. We therefore do not use the waterfall approach with complex projects and prefer instead to take a cyclical approach which we find provides much greater value than the waterfall method.
Often clients and stakeholders ask for the waterfall method because it is relatively predictable and standard for most projects but is also easy to distribute finance. But on the other hand projects may be planned using waterfall yet are expected to be flexible. If so, the outcome can get messy, thus it is important to explain how we approach project development and how the client and stakeholders are involved.
Four steps for working with complexity
The steps described here are guidelines for how we use the Compass. The process is simple enough to be applied to any project where the outcomes are unclear. Often the Analysis and Objectives occur simultaneously however once the development cycle begins, the Objectives must not change.
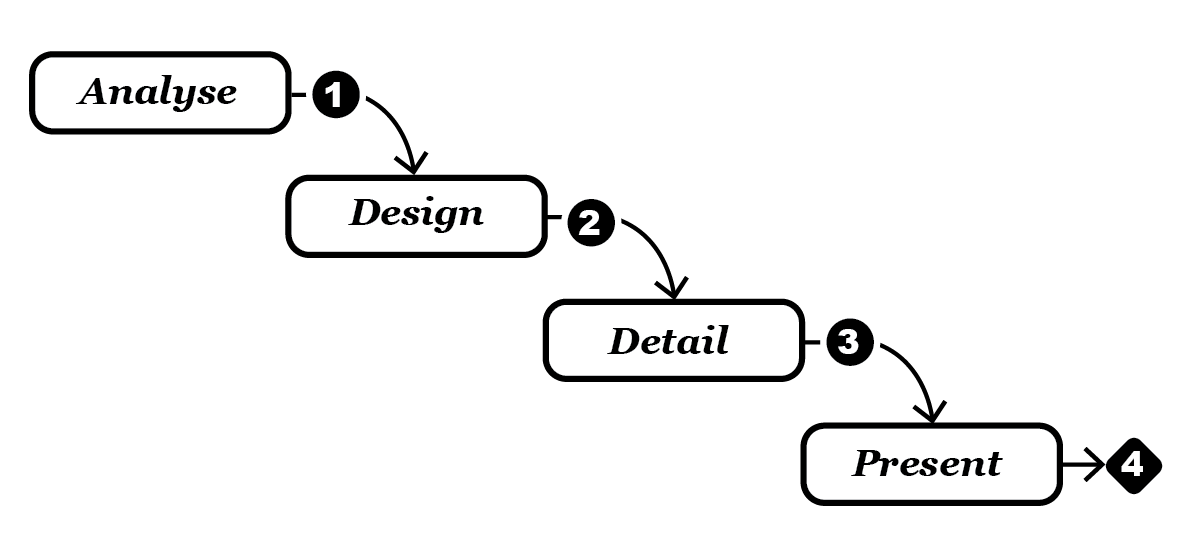
1/ Analysis
The analysis stage is about the ‘why’. It is about looking for the root of the problem. The analysis helps to gain a vision of the whole before investing in solutions or particular outcomes. We use two levels of analysis.
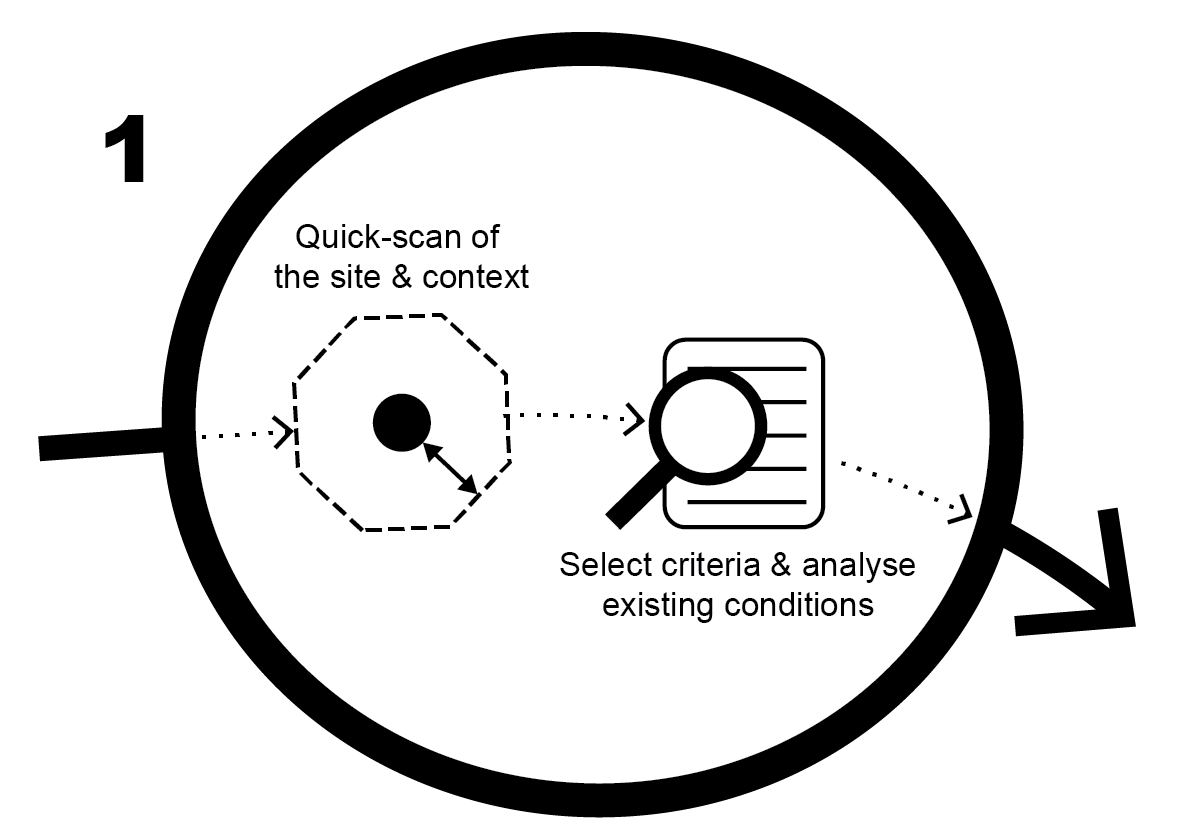
Firstly the Quick-scan is used to get a very quick sense of the project is based on the 35 Themes. Each Theme contains a range of questions and objectives. The quick-scan can be done before the project even has started.
After the Quickscan, a full analysis can be made. The analysis is based on the Sub-Theme or Aspect level (depending on the time budget available and the level of detail that is wanted). Scores are given based on firstly on the condition and secondly the relevance. Irrelevant Sub-Themes/Aspects are scratched from the analysis process. This provides a full picture of the initial performance of the site and exposes issues that require particular attention. This analysis occurs alongside site visits, maps/plans, images/videos, planning documents and other relevant material. At this stage a suitable area of influence for the project must be defined.
2/ Objectives
The objectives define the ‘how’. Through the analysis it is possible to identify priorities. The priority list then helps to set project objectives which is best done together with the client/stakeholders. This means that the objectives and responsibilities can be translated into work.
While the objectives are guidelines and relatively vague, it is important that they do not change until the end of the project. If there is a reason for the objectives to change, then the project can change course. In this case it can be better to restart the project or redefine the scope. If the project objectives are likely to change regularly, then shorter periods should be set with fewer or more attainable projects objectives.
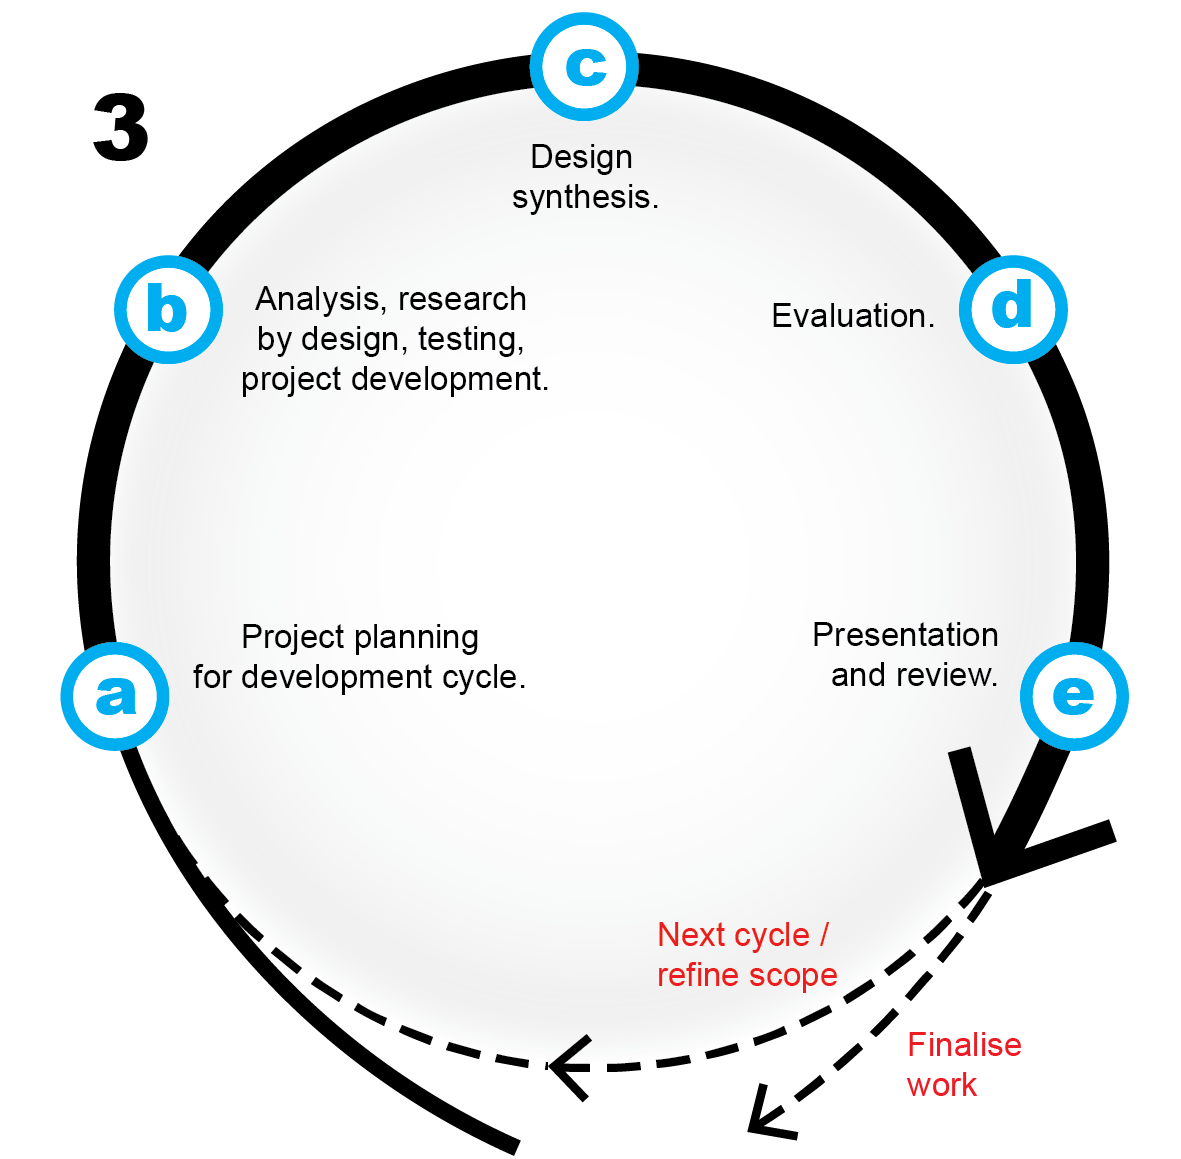
3/ Development Cycle
The development phase is about elaborating the ‘what’. During the development phase we use an iterative cycle. Such an approach applies perfectly to complex urban planning projects as it means that ideas are tested quickly and adapted rather than leaving the evaluation to the end of a project. A cycle (or sprint) will result in a ‘minimum viable product’, in other words something that can be used to test progress.
The cycle may last a few weeks to a month and within this time, tasks are fairly clearly defined. Cycles may occur internally (the core team) or externally (with stakeholders or partners). However the idea is that they occur regularly to ensure that the project follows the core objectives and that the process can be refined and discussed.
The cyclical design process involves:
- a/ Planning involves defining ‘to-do’ list of items to be developed within the following cycle.
- b/ Design is about the exploration of ideas whether it is about analysis, sketching, workshops, creating plans and/or prototyping. Time can be set to do this if outcomes are clear. However if design process is exploratory, outcomes should be loosely defined and time-limits should be accepted. Here the compass map and knowledge base is used for ideas and inspiration and to help focus the design.
- c/ Synthesis is the development period where relevant plans, models, details and reports are produced. It is important that some of these tasks have clear time limits to avoid miss-using time. If the allotted time is insufficient, the task can be carried through into the following cycle.
- d/ Evaluation uses the evaluation tool (see below) to test how Sub-Themes or Aspects are faring compared the existing conditions and the project ambitions. This may not involve a full evaluation and may focus simply on the project’s main objectives.
- e/ Review involves reflecting on all the work that has been produced within that particular cycle. A presentation may be formal or informal and involve the team, client or stakeholders. Once the work to take has been reviewed, it is possible to decided if the project is completed (based on the initial objectives) or if to continue on another cycle.
This cyclic approach helps to focus the project, to test options and to get rapid feedback while allowing the project to adapt to new knowledge. It requires that the team / client / stakeholders are comfortable with the iterative and exploratory nature of the project. It is possible to quickly change approaches at the Planning stage of each cycle and it means there are moments of collaborative input at each stage. Finally it helps define very clear outcomes within each cycle to avoid confusion within the team.
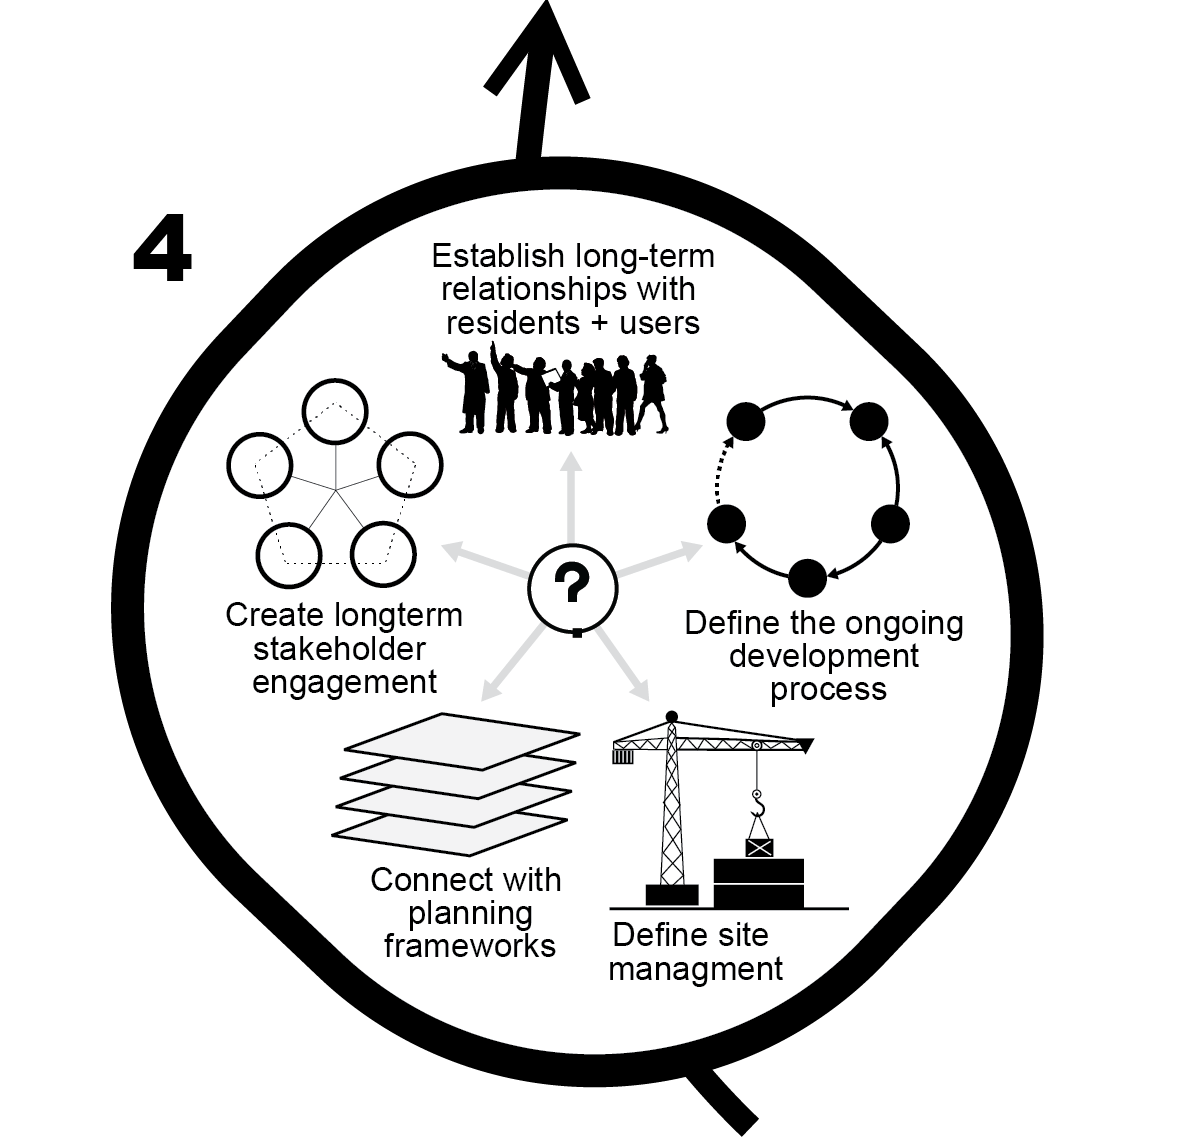
4/ Define Long-term Strategy
As we are talking about complexity – a project should be treated as an interpretation of the objectives but not an end in itself. Through seeking clarity in complexity, particular actions can be made that help further resolve the project objectives. It may involve further research with specialists, engaging stakeholders and residents, defining ways the project vision can be developed, specific construction opportunities and so on. Considering the knowledge gained while developing the project, it is necessary to help guide this stage along or at least help those that can.
2. Navigating with knowledge.
Knowledge is abstract and makes design a messy process.
One of the biggest problems with sustainability, particularly in urban areas, is the vast amount of knowledge required which is spread across numerous disciplines. Unlike ‘Deep Thought’ – the Hitchhikers Guide to the Galaxy* computer that took 7.5 million years to calculate the meaning of life – sustainability is about quickly and confidently finding the ‘least-worst’ outcome. By least-worst we mean: lowest impact and best possible quality. For most of us, we need to know three things;
- How to access relevant knowledge,
- How to identify the most critical issues and
- How to find links between relevant knowledge areas.
But we must be cautious.
Firstly we should be cautious about assuming ‘causality’. Crime, for example, may be linked to unemployment but this is a trend and not a rule. The objective therefore is to define the ‘problem situation’ – borrowing a term from Soft Systems Methodology.
Secondly there is also a danger to look for connections between everything. While everything may be linked, not everything is relevant to a specific problem. Narrowing the focus has its pros and cons. As we learn about a problem, we need to constantly refer back to the main project objectives and thus constantly ‘question the main question’ throughout the project. Is the project on track? Have we missed something?
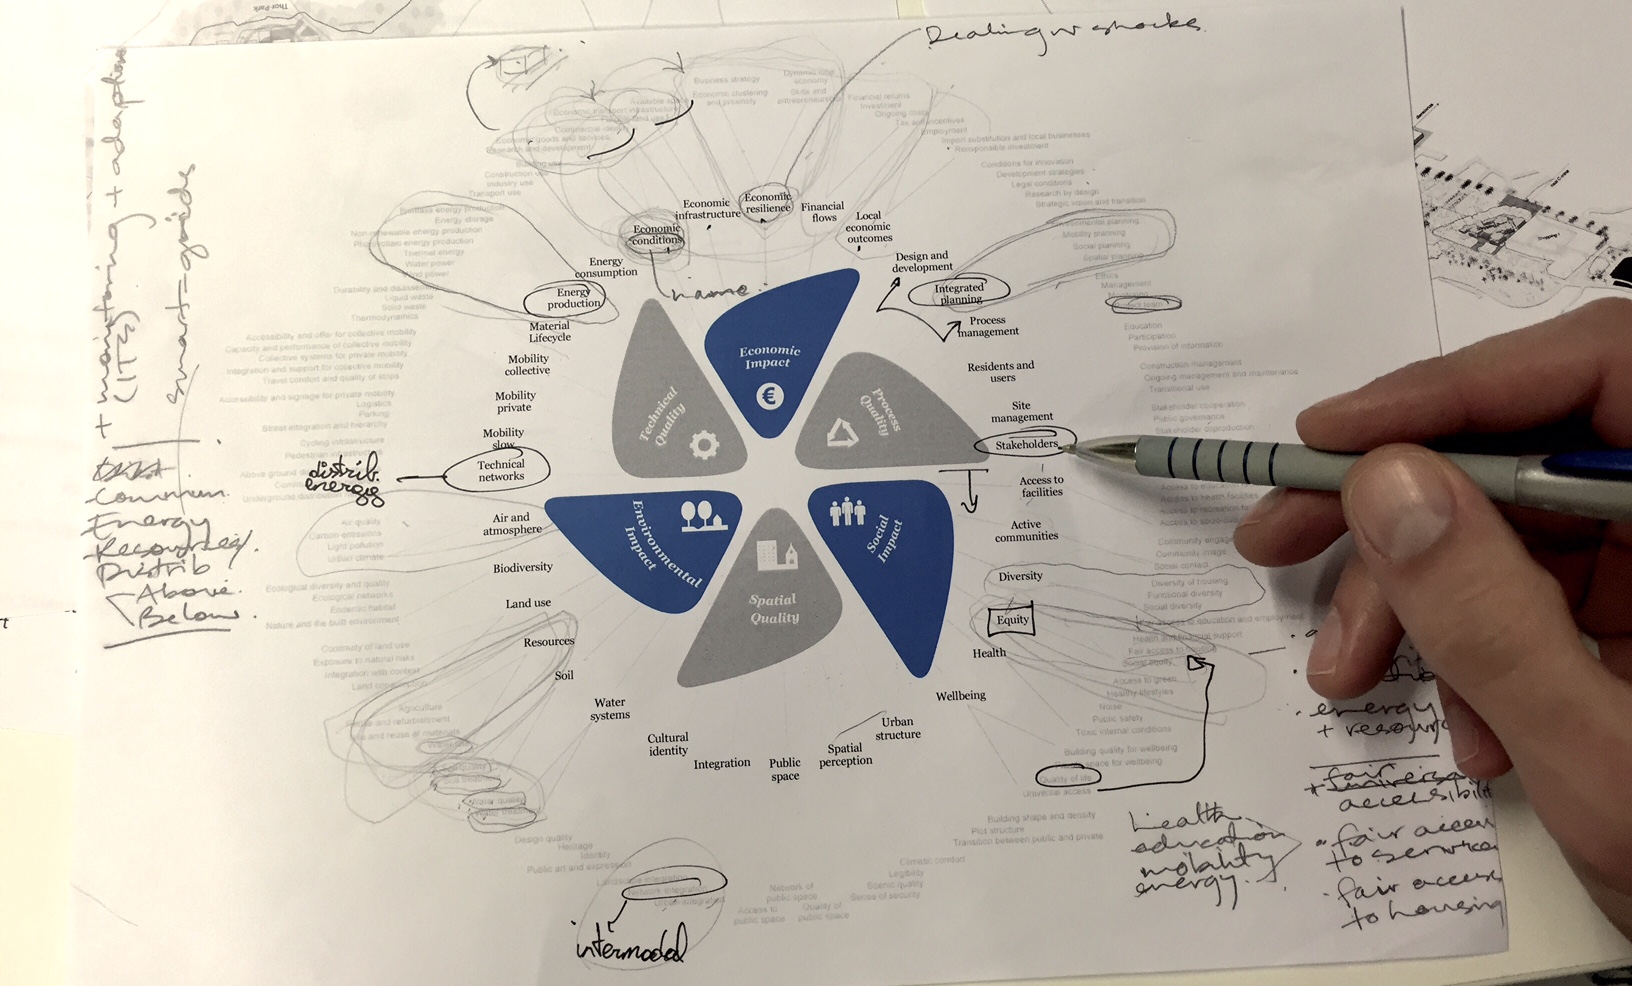
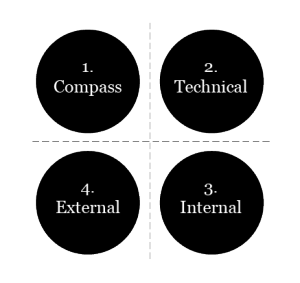
It helps to have one’s knowledge well organised. We mentioned earlier a knowledge hierarchy to help distinguish between meta and matter. In addition we have created four knowledge groups to help structure our thinking process:
- The compass – description of the Fields, Themes, Sub-Themes and Aspects.
- The technical knowledge – theories, techniques, rules, regulations, policy and standards.
- Internal projects – to document experiences and build on knowledge.
- External projects – that help set objectives show best practice.
These four groups are highly interwoven and helps us to: evaluate projects, find solutions, learn from experience and seek inspiration.
Defining a problem area
We feel it is important to break a problem into small manageable pieces. This is about defining the problem area for that particular project.
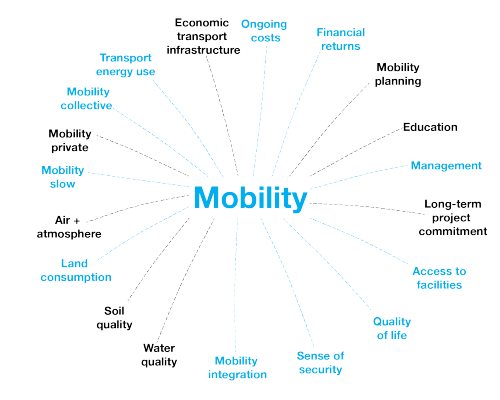
Many of the sustainability assessment models we explored (see here) start off by categorising knowledge into quite specific topics such as: ‘energy’, ‘mobility’, ‘health’ and so on. We find this misses a step. For example, mobility depends heavily on energy and health can be influenced by both the energy system and how one moves around.
In defining a problem area, we must go through a selection process. For instance a topic like ‘mobility’ represents many possible issues including: infrastructure, how people access facilities, the movement and selling of goods, the culture of a place and so on. It is far more efficient to find the issues requiring greatest attention – of which there is no scripted solution. We therefore do not define what the ‘mobility’ problem means until we have properly analysed the particular mobility system and its context. We do this during the analysis phase.
Linking knowledge
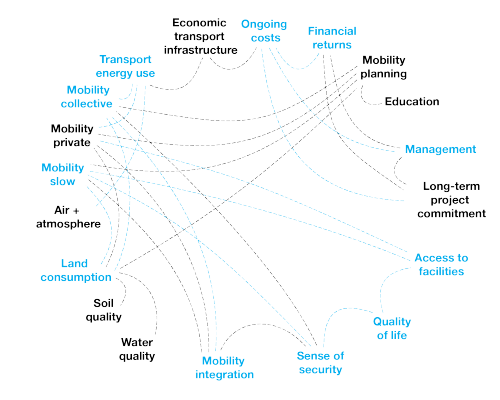
A second challenge is in linking relevant blocks of knowledge. What is relevant will evidently change from circumstance to circumstance so it is important to always remain open.
For example, the effectiveness of a tramline in one case may be influenced by the type of infrastructure, the planning process, the demographics of the population, the culture, access to shops and jobs and sense of safety. But in another case, the problem may be about just about timetabling and the comfort of the stops.
In short there is no way of foreseeing the relevant links between segments of knowledge until the scope of the project has been properly analysed. What is important is that the knowledge-base is well organised to show possible links between topics. When the project begins, links can be established between those topics that are considered most important.
Navigating knowledge
We use a dynamic Wiki database platform to organise the knowledge we collect. The main objective is that knowledge is available and can be regularly improved or updated. Likewise, the knowledge base must be flexible and open enough for anyone to use intuitively and to get a very quick summary of the important issues.
We have four main pillars of knowledge:
- Compass topics. Extensive information on the Fields / Themes / Sub-themes / Aspects. We use this section to evaluate projects and set objectives.
- Technical information. Technical details, rules and regulations, planning documents, theoretical information and so on.
- Internal project experience. Where we can refer back to experience with certain topics (for example water management or renewable energy) in previous projects.
- External references. Which can be used to define what can be considered to be ‘best practice’, as a database of tested strategies and inspiring examples.
3. Analysing projects & setting objectives.
We consider that no project can respond to all aspects of sustainability. However it is important to be able to see what qualities are performing well or poorly and then to define which can be improved with as little impact possible.
As no site is the same, we do not propose using a template related to certain project types – for example mobility or housing projects. Urbanism projects should always be mixed and the mixed cannot be prescribed. This means that every project must be evaluated from scratch to determine the most relevant issues.
Evaluation.
Regardless of the project it is important to evaluate performance levels in order to understand the strengths and weaknesses of a site/area. Evaluating helps also to prioritise objectives in multi-disciplinary groups where stakeholders or team members have different priorities – this process helps rationalise why to invest in certain issues over others.
We evaluate projects and set objectives on the Sub-Theme and Aspect level. Depending on the topic, the evaluation may be qualitative or quantitative. The evaluation involves two parameters:
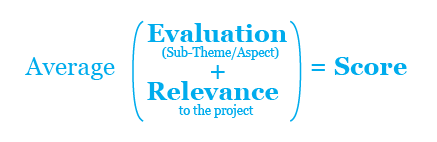
- Evaluation of the Sub-Theme or Aspect.
- Relevance of that Sub-Theme or Aspect to the project.
This means that we can be very easily prioritise issues. For example an inner-city site may have very high energy consumption, however the energy consumption may not be very relevant compared to other issues. We propose a fairly simple evaluation formula:
Setting objectives.
Once a site or project has been evaluated, certain Sub-Themes or Aspects can be used to set ‘objectives’.
Selecting objectives is a great way to draw stakeholders or actors together and to share responsibility for decision making. In fact it is important that certain objectives are set amongst a team or stakeholder group from the outset to ensure the objectives reflect collective interests. Objectives need to be selected carefully to avoid ‘siloing’ by focusing only on certain issues or losing perspective. For this reason we aim to select at least a minimum number of objectives from each field.
Objectives are set specifically for the site – taking into consideration ‘best practice’ examples and reasonable comparisons. Objectives can be unique (like reducing carbon emissions by 10% in 5 years) or relative (consider Copenhagen’s city-wide bike modal share of 26% to be best practice). This means that we are not setting irrelevant objectives based on what is considered best ‘global’ practice. For example, capacity for a tram in say Brussels is compared with similarly used lines in places such as Antwerp, Amsterdam or even Cologne that have relatively similar conditions. Information about best practice, regulations and scientific data that helps setting objectives, is offered in the knowledge database (see above).
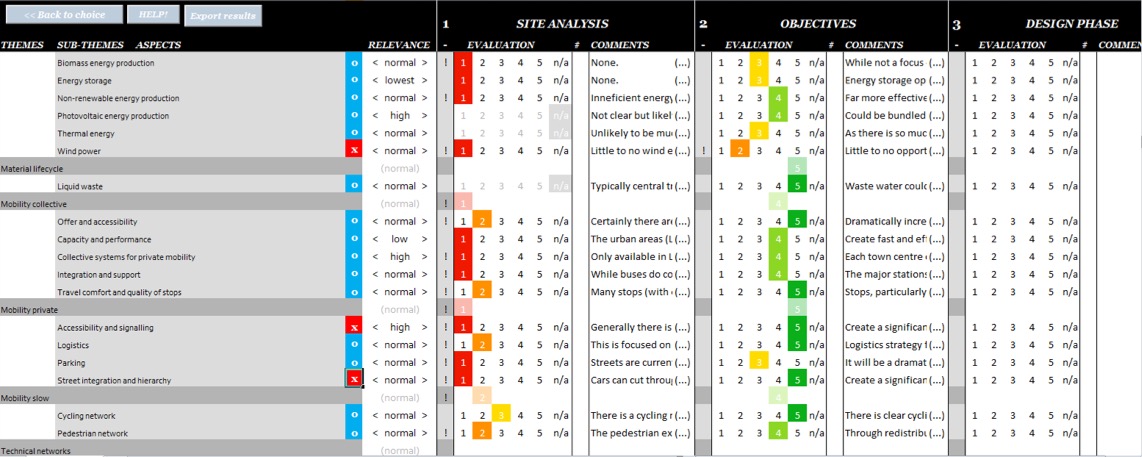
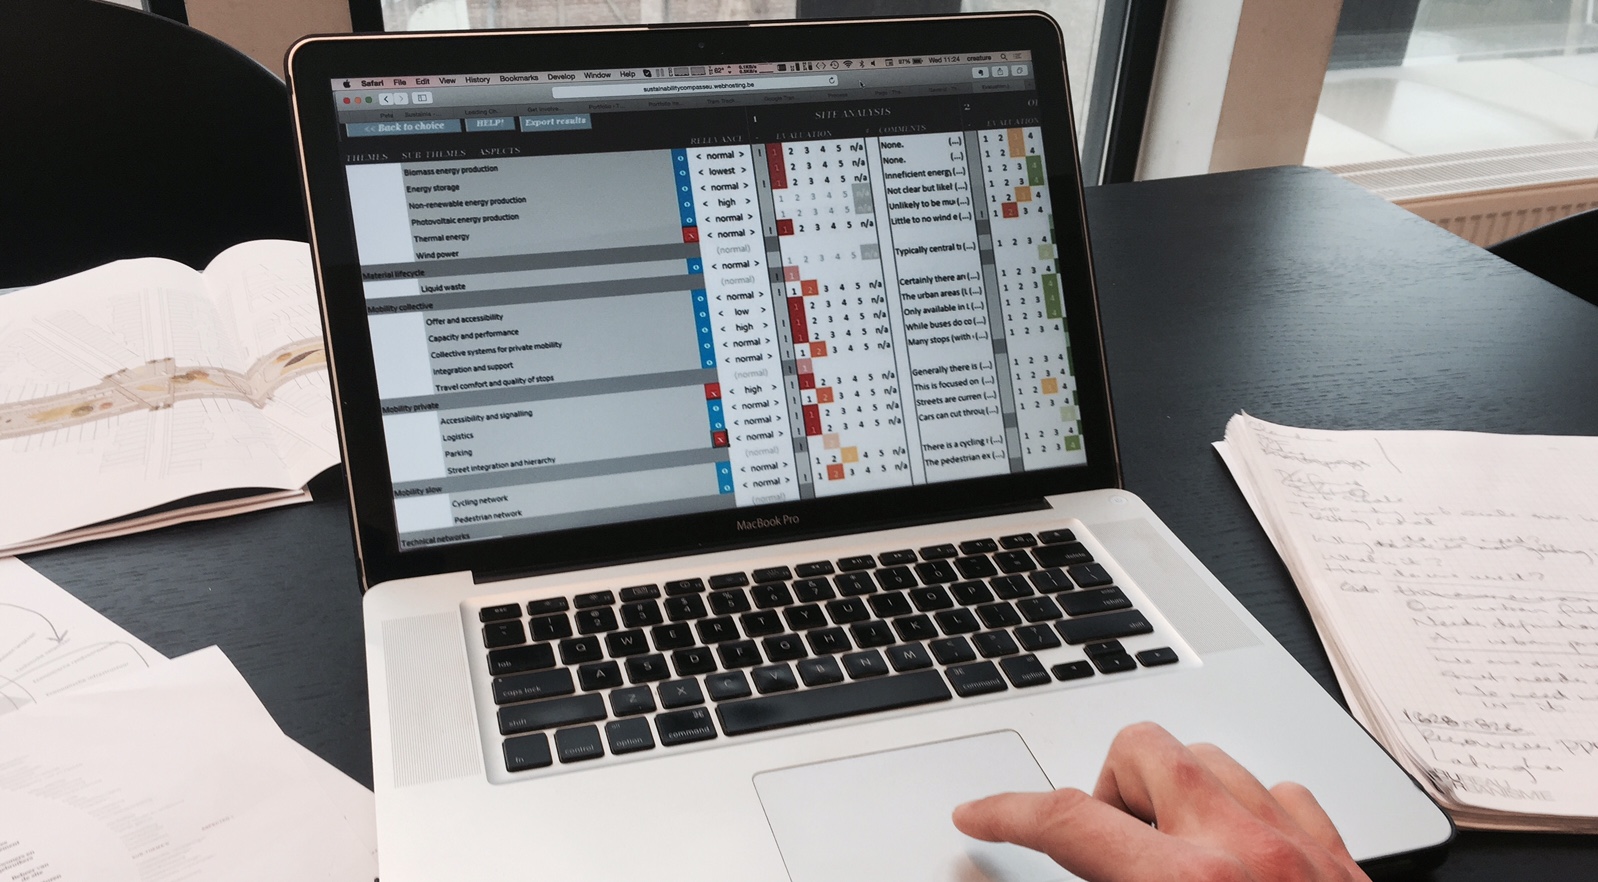
Evaluation Tool
For the evaluation process, we created a tool in MS Visual Basic and is used through MS Excel. The evaluation tool follows the complete design and development process of a project. This allows users to browse between hierarchies, select relevant elements and measure performances of sites and design proposals.
To get an idea of how the tools is used, it follows these steps:
- Run a Quickscan of the based on the 35 Themes to gauge the qualities of the site/project.
- Evaluate the existing conditions of the site. Decide the level of detail (Sub-Theme or Aspect level).
- Identify priorities based on the evaluation of the existing condition, the tool automatically generates a priority list.
- Determine objectives. This means shortlisting the most significant Sub-Themes / Aspects to focus on and set preliminary objectives (generally with the team / stakeholders / client).
- Evaluate the design outcome. This is usually done at the end of each
The actual scores are discussed with the team, client and stakeholders to ultimately define objective and evaluate decisions.
4. Reporting.
The final step involves synthesising the data to make it presentable and simplified for a general audience – it is about creating a micro-image of the conditions and ambitions of the project. This is an important step as as the state of the project is synthesised and communicated, to anyone, without having to wading into a vast amount of technical detail.
A number of sustainability assessment models use similar approaches, based often on a Ameba graph or bar-chart. Arup’s SPeAR* involves a simple circular diagram based on 20-30 topics which are rated from 1-5. DGNB* follows along the lines of Arup’s approach, showing some 40 variable. Engineering firm Halcrow called Halstar* (now CH2M Hill) uses a traffic light approach with a greater number of variables.
One of the biggest problems encountered with graphs is over-simplification of the data. A second problem is that it is difficult to show progress – in other words comparing the existing conditions, the objectives and the design outcome. Finally a third problem is that in many cases all scores are shown equally while it is clear that on some sites/projects there are much more pressing issues than on others.
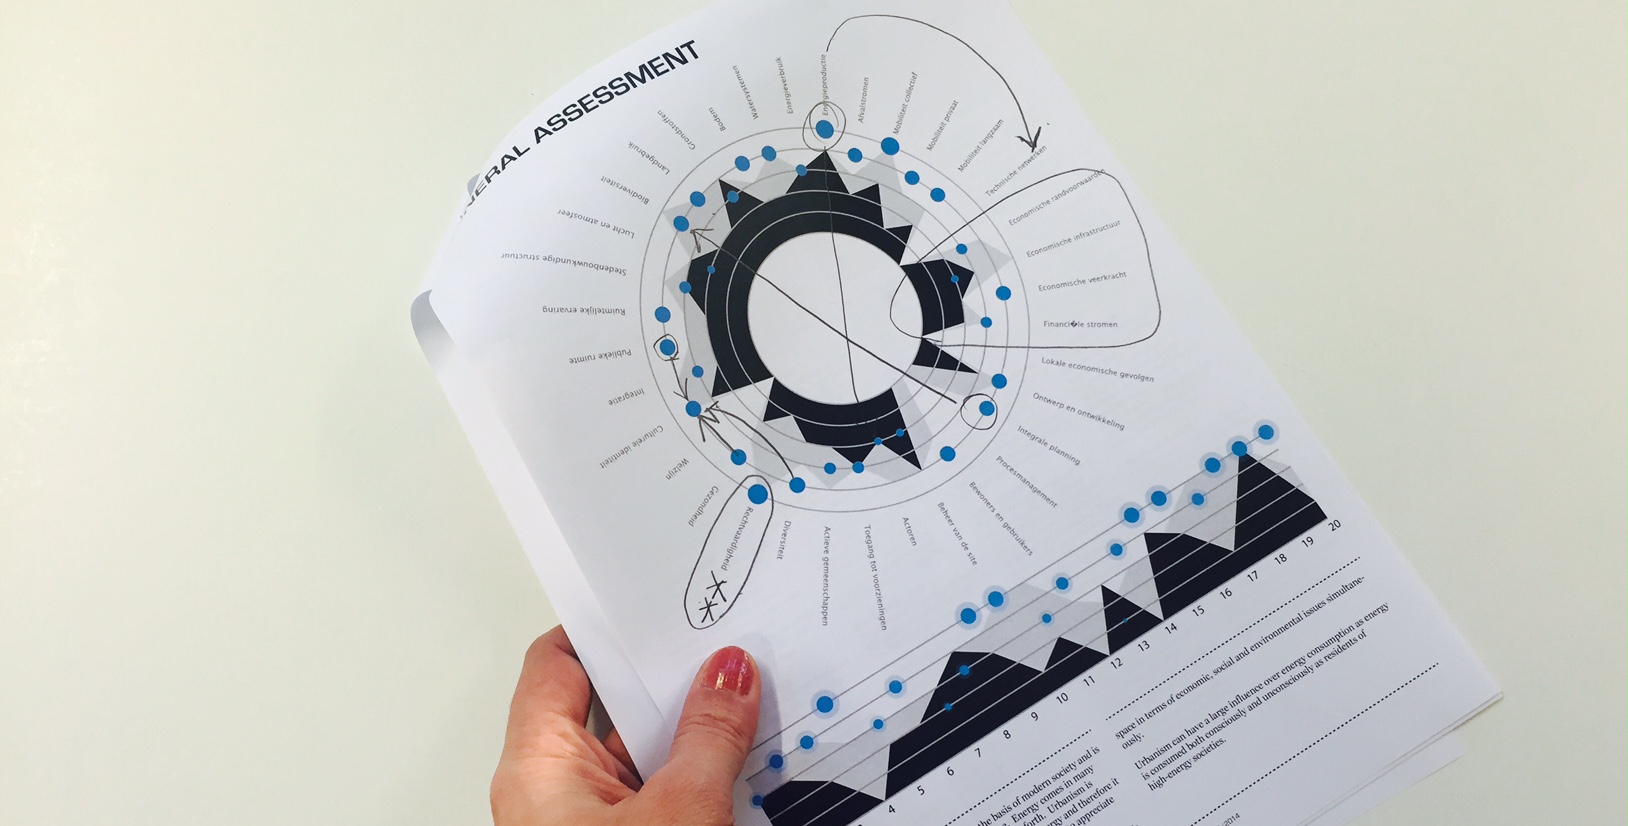
We aim to have both a system that is easy to read yet specific enough to avoid excessive simplification. We thus have two types of graphs – firstly a circular diagram summarising the whole and then a particular diagram focusing on the specifics.
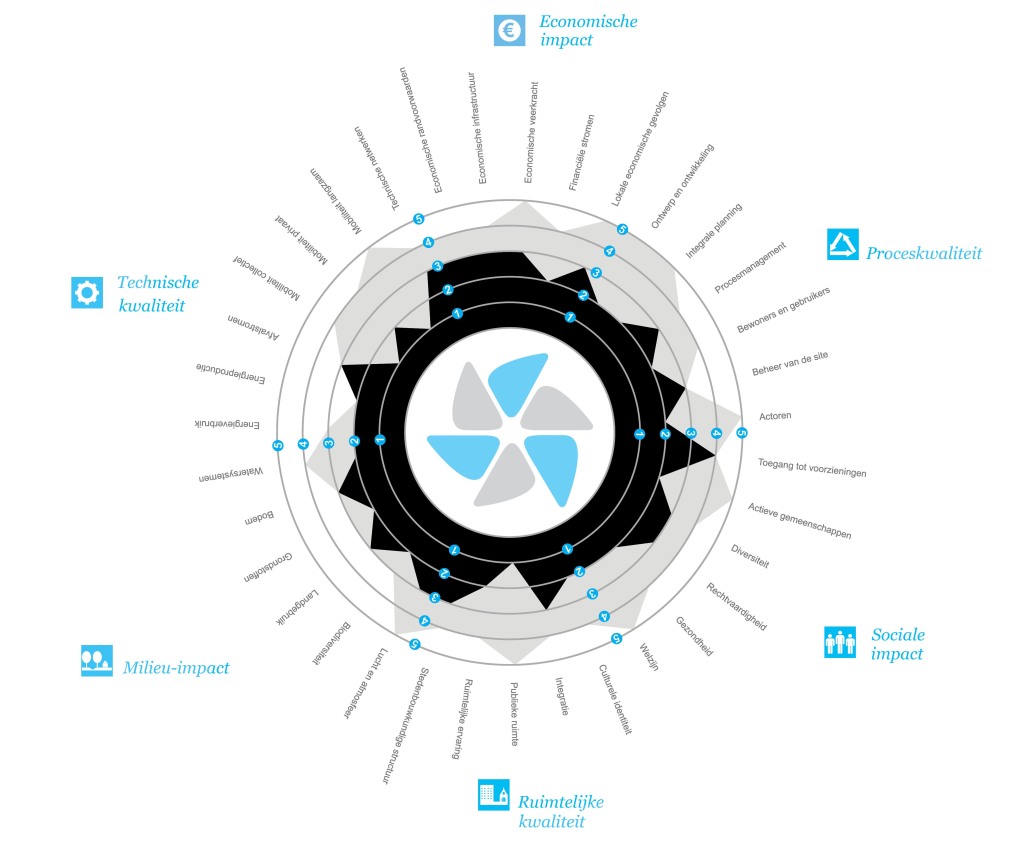
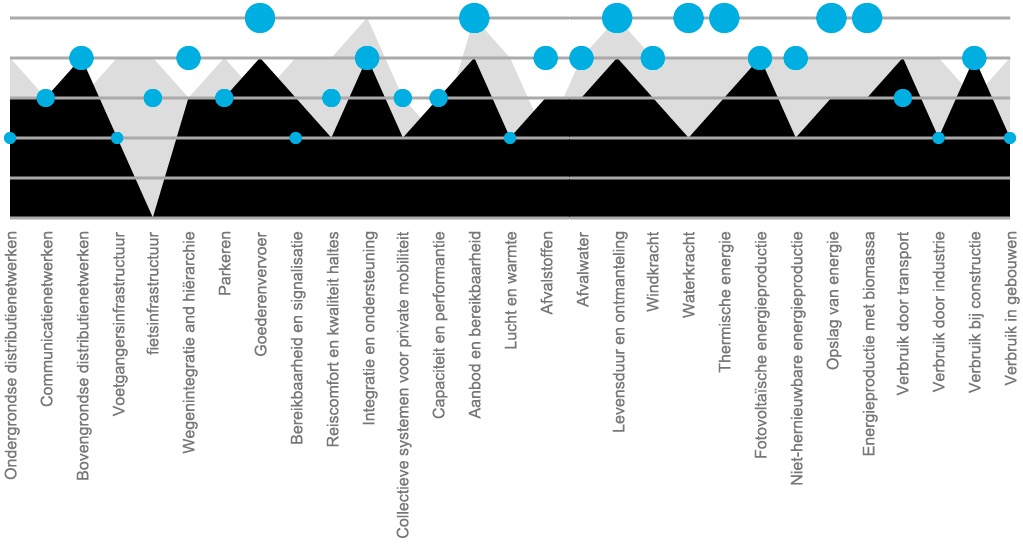
Our evaluation can be summarised as a collection of three types of graphs. Each of the graphs contains three layers of information – the analysis, the objectives and the final outcome:
- The overall performance of a project, at the Theme level – this is an aggregate of the Sub-Theme or Aspect level scores (see diagram above).
- The scores at a Sub-Theme / Aspect level based on each of the six Fields – example below.
- A graph which shows exclusively those Sub-Themes / Aspects that have been selected as project objectives – example below.
The tool is essential for both internal and external discussions. Without such a tool, it can be difficult to translate the complexity and progress of the project without forcing the team / client / stakeholders to read extensive amounts of supporting information.
SEE HOW IT HAS BEEN APPLIED TO PROJECTS >>
© All contents of this site is copyright to BUUR cvba. No reproduction without formal consent.